Author Archives: Cindy

Finding a Balance within Narrative and Data

This past weekend I had the opportunity to visit some of my friends who live in Detroit. Although I had lived in Michigan for two years, I had not yet explored much of the city. Thus with our CHI Fieldschool project, I was both excited and hesitant to build a website centered on the city.

Understanding the revitalization initiatives in East Jefferson

Understanding the revitalization initiatives in East Jefferson

How could we capture the complexity of a city such as Detroit? From history to music, business to politics, Detroit could not be reduced to one narrative. One of the centerpiece goals of our project was to highlight the multiplicity of Detroit as a place–one instilled with diverse stories from local communities, politicians, and business initiatives.

As a member of the Development team, I learned quickly that a ‘data-driven’ project did not directly imply objectivity. All of our messy data sets contained a measure of subjectivity in how and why we selected or excluded certain things. When helping to wrangle the data for “Speaking-Community Development in Detroit,” I faced the difficulty of finding a balanced set of parameters of which organizations to include. At the same time, I sought to acknowledge our original goals and somewhat presentist understanding of the city; much of the impetus to create such a visualization was to indeed explore the spirit and multiple definitions of ‘revitalization’ that we witnessed.

East Jefferson Revitalization Initiatives

In seeking a delicate and difficult balance, I realized too the striking parallels of selection methods to my own discipline of history. Like my constant reminders to self in my own historical research, I hope that our Digital Detroit project can illuminate a piece of past and display the complex spirit of the present.

For more information on the East Jefferson Corridor initiatives:

Crain’s Detroit – Revitalizing East Jefferson

East Jefferson Corridor Collaborative


Project Planning and Management Tools: Group Thinking and Writing through Google Docs

This week we came up with the gameplan for our “Detroit Digital” project, and used a variety of tools to help us in the process. Along with the variety of ‘group tools’ such as collective brainstorming, individual written reflection, and small team discussions we also used the following digital tools: Google Docs, Base Camp, and GitHub. In the first (and most difficult) stages of our project, we had to come up with a project that stitched together the broader narrative and doable specifics of data. This process was incredibly challenging and involved a lot of reflective thinking and discussion. However, Google Docs and Google Docs Spreadsheets was incredibly helpful as a platform for multi-staged collaborative thinking and writing.

We used google docs to compose our official vision document and a more detailed workplan. As a platform Google Docs is simple, sleek, and has a low barrier of entry (fully on cloud, no need for account, although a linked Google account makes things more manageable). As a space for collaboration, Google Docs can be very effective if tasks for a group are specific rather than general. For example, when writing up our vision document, only a handful of individuals contributed to changing the text while the majority of the group added comments to the side. Although the comments were overall helpful, they did not move the process forward without a more thorough in person, followup discussion. Furthermore, Google Docs does not ‘track changes’ in the same way as a word processor that allows for clearer comprehension of who made changes and what was changed from the original document. However, when given a more specific task such as full authorship on a particular section of the workplan (a great idea by our wonderful project manager Taz!), Google Docs was an effective planning tool for a group to quickly contribute, discuss, and amend.


CHI for a Historian-in-Training Part 2: Mapping a Narrative

Since my last post on ‘translating’ a document to data, we explored tools to visualize space such as CartoDB, Mapbox, and Leaflet and toyed with some data tools such as Tableau and Google Fusion Tables. With this short introduction to spatial and data visualization, we were handed the task to come up with a group visualization project.

Throughout our discussion for the group project, I realized that one of the primary issues we confronted was the important although often nebulous distinction between a visualization project and the mapping of cultural heritage. Even in my own brief proposal, I realized that my understanding of a ‘visualization’ was very much linked to maps and spatial representation. My idea was to integrate in some form several detailed and beautiful historic maps of Saigon that are housed in the MSU Archives & Historical Collections in order to understand the evolution of Saigon as a city, administrative base for the Republic of Vietnam, and development over the course of the Vietnam War. As in my example, overlaying ‘maps on maps on maps’ could be a useful tool to understand historic events and change over time, but lacked the dynamism of a data intensive narrative. This distinction has pushed me to think deeper about what I want to do and what is possible. In the case of a lot of historic themed projects, neat data is hard to come by and must be collected, organized, and cleaned up before it can really tell a story. It looks like for my own projects I will have to begin back at that step before I can create a visualization that integrates both space and data.

Although I might confess that I still might not fully understand the difference, I think I have a better sense now of what constitutes a good visualization–a combination of data and a narrative.

CHI for a Historian-in-Training Part 1: From Primary Document to Data

As a history graduate student, I wanted to blog mainly about how this fieldschool has influenced the way I approach historical research and thinking.

Last summer I had the chance to travel to the colonial archives in Aix-en-provence, France (Archives nationales d’outre mer or ANOM) to get a taste of ‘primary docoument archival research.’ Armed with a digital camera, a macbook, and a French dictionary, I bumbled around the archives, attempting to mirror the sense of confidence and purposefulness that other scholars seemed to have. After a month of 9-5’s at the archives (and evenings of pastis and concerts in Aix), what did I have to show for my dedicated data-collecting? Over 3,000 poorly labeled digital photos, an incomprehensible excel sheet of ‘important!’ records, and the overwhelming sense of gloom that I would never get through the endless number of primary documents needed to do my research.


My Excel Notes: I know this made sense at one point...

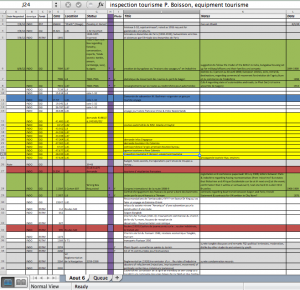
My Excel Notes: I know this made sense at one point…

After a speedy bootcamp introduction to data this week, I now realize the incredible importance of creating a sensible workflow and metadata structure as I am doing archival research. Historians don’t necessary call this process ‘data-collecting,’ but looking at the process that way could be an useful way to save time and not feel overwhelmed. The topics this week didn’t necessarily address organization and workflow, but in our discussions about cleaning/scraping/visualizing data, it reminded me to think about the basic components needed to produce good data.

1. Organization is Key

For historians,’data-collecting’ is akin to semi-purposefully/randomly reading old documents with a theme in mind. With the ease of digital photography, OCR, and more and more online databases, many scholars including myself fall into the trap of ‘over-collecting.’ Although over-collecting can be helpful to make more thorough and better supported arguments, your data won’t be of any use if it’s not organized. Most simply you need 1) a place to store the metadata (data that gives information about other data, e.g. title, author, date, publisher) of each record and 2) a way to insure you can find the original file. Some scholars do this by an excel sheet and subfolders in their harddrive. I have personally used Zotero to input my metadata and Dropbox and Mac Timemachine to continually back up my data. Although it might seem to take a lot of your time, detailed recordkeeping will prove useful when you return from field research and begin your writing stages.

  • Other useful pre-archive tips to keep in mind : Link
  • A full guide to archival research including a ‘record keeping sheet’ that can be an example for your metadata schema: Link

2. How can a Historical Text translate to Data?

In my own research on Vietnamese travel stories, I deal with a lot of narratives and reports that don’t automatically translate into ‘hard’ data that can be easily visualized or manipulated. Like other disciplines that do close readings of texts and qualitative analyses, history can seem antithetical to large datasets and quantitative analyses. However, data-oriented methods such as ‘text-mining’ seem to be making their way into changing traditional humanistic inquiry and research. Essential to analyzing large and small data sets is the actual collection of metadata that describes the object. This is no simple task though because it also involves the larger question, “what do you as a researcher want these objects to say/show/prove/demonstrate?”


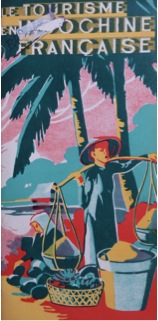
Tourism in Indochina Travel Brochure

I have just submitted to my committee my thesis titled “Where People and Places Meet: Travel and the Spatial Identities of Indochina, France, and Hue in 1920s-1940s Vietnamese Print,” where I examine tourism advertisements, socio-cultural reports, and travel stories, or du ký, to understand how travelers ideologically ‘mapped’ places with cultural, colonial, political, personal significance through the publication of their travel experiences. As you can tell, this study was quite textual and theoretical in nature.  Even though I have extensively read and analyzed these texts, I did not extract these sources for data in a consistent method. I started to reflect how I could input relevant components into a table (such as traveler name, gender, age, group size, destinations, and transportation), and in doing so, I have already begun to look at my research in a different way. I asked basic questions such as “How do these texts relate? How are they different?” to “Are there more isolated journeys or group journeys? What are the primary modes of transportation represented?” 

I am currently brainstorming different ways of translating these textual representations of movement into a visualization, such as a map of the popular travel routes with a temporal component to understand global events and transportation developments. Hopefully by next week’s blog post I will know a lot more about visualizing data and space and get a better sense of my project.


Introduction to Cindy Nguyen

I’m originally from Los Angeles and in a little over a month I will move back to California for the Ph.D. program in Southeast Asian history at Berkeley. In my time here at Michigan State, I finished an M.A. in history, experienced ‘seasons’ for the first time, and developed a curiosity for digital humanities. My work on the MSU Vietnam Group Archive, a digitization project spearheaded by the MSU Department of History, MSU Archives & Historical Collections, and MATRIX, initially sparked my interest/confusion of the possible combination of ‘digital’ and ‘humanities.’I particularly enjoy the collaborative nature of many digital humanities projects including the Vietnam Group Archive. I’m still learning about this wonderfully exciting world of dh resources, events, and centers, and hope that this summer’s field school will continue to broaden my understanding.

 I am also interested in the methodological possibilities of digital humanities in the representation of space and movement. My current research explores the flourishing culture of Vietnamese travel embodied by the surge in travel stories (du ký) and advertisements published primarily in romanized Vietnamese newspapers between the 1920s and 1940s. With the work of data crunching and GIS software, I hope to also ‘translate’ the textual representations of travel into a visualization of Vietnamese movement more broadly from the 16th century to 20th century. In this wider comparison of the rich sources of precolonial and colonial travel stories, maps, and itineraries, I seek to shed light upon the distinct changes and literary continuity over time. I believe that digital tools, larger data sets, and GIS can be useful tools for textual based research and can help bridge to the divide between ‘qualitative’ and ‘quantitative’ research. For more on my research, see my Academia.edu page.