This past weekend I had the opportunity to visit some of my friends who live in Detroit. Although I had lived in Michigan for two years, I had not yet explored much of the city. Thus with our CHI Fieldschool project, I was both excited and hesitant to build a website centered on the city.
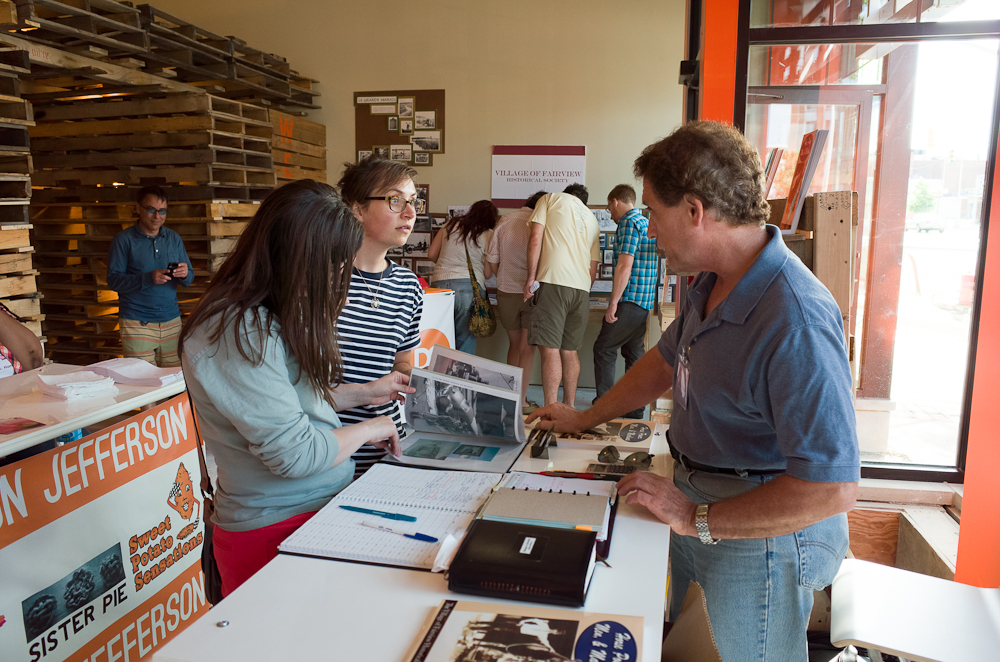
Understanding the revitalization initiatives in East Jefferson
How could we capture the complexity of a city such as Detroit? From history to music, business to politics, Detroit could not be reduced to one narrative. One of the centerpiece goals of our project was to highlight the multiplicity of Detroit as a place–one instilled with diverse stories from local communities, politicians, and business initiatives.
As a member of the Development team, I learned quickly that a ‘data-driven’ project did not directly imply objectivity. All of our messy data sets contained a measure of subjectivity in how and why we selected or excluded certain things. When helping to wrangle the data for “Speaking-Community Development in Detroit,” I faced the difficulty of finding a balanced set of parameters of which organizations to include. At the same time, I sought to acknowledge our original goals and somewhat presentist understanding of the city; much of the impetus to create such a visualization was to indeed explore the spirit and multiple definitions of ‘revitalization’ that we witnessed.
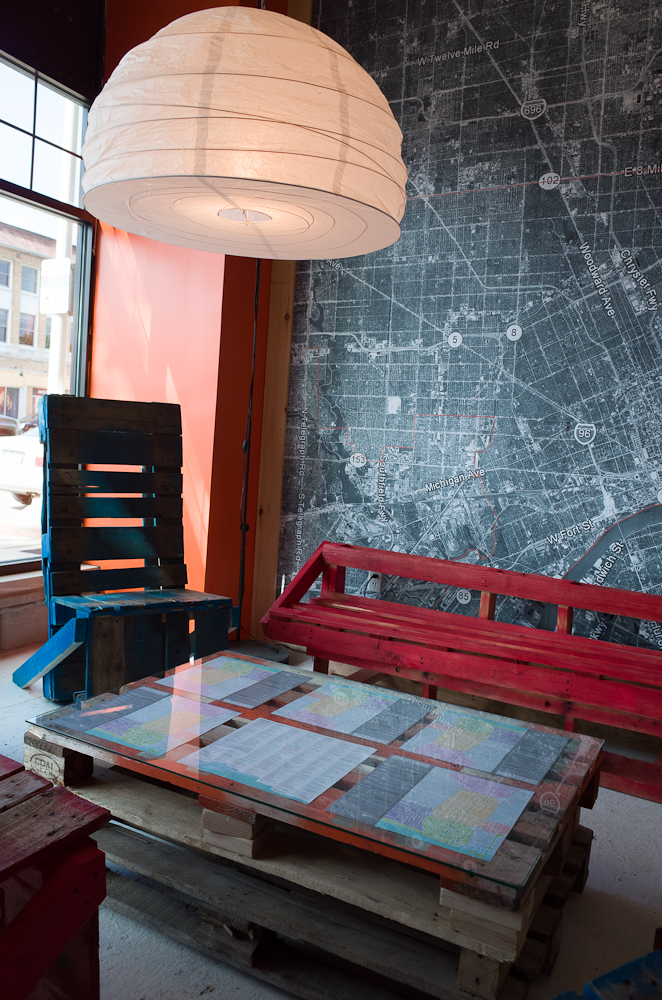
East Jefferson Revitalization Initiatives
In seeking a delicate and difficult balance, I realized too the striking parallels of selection methods to my own discipline of history. Like my constant reminders to self in my own historical research, I hope that our Digital Detroit project can illuminate a piece of past and display the complex spirit of the present.
For more information on the East Jefferson Corridor initiatives:
Crain’s Detroit – Revitalizing East Jefferson
East Jefferson Corridor Collaborative